Global air cargo load factors produce positive start to 2021: CLIVE
February 5, 2021: Exceptional global air cargo load factors in the last two weeks of January saw 2021 begin with an unusual New Year ‘peak season’ as demand and supply were closely matched, according to the latest weekly market data from industry analysts CLIVE Data Services and TAC Index.

February 5, 2021: Exceptional global air cargo load factors in the last two weeks of January saw 2021 begin with an unusual New Year ‘peak season’ as demand and supply were closely matched, according to the latest weekly market data from industry analysts CLIVE Data Services and TAC Index.
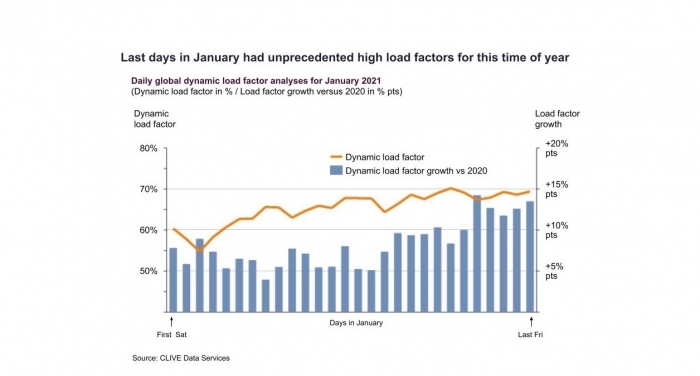
CLIVE’s ‘dynamic loadfactor’ analyses for the first four weeks of the year ending 31 January, based on the volume and weight perspectives of cargo flown and capacity available, shows a load factor of 66 percent, up 9 percent pts year-on-year. The global dynamic loadfactor for the last two weeks of January, however, saw an exceptional 10-15 percent pts rise over the same days of January 2020.
Strong, and historically atypical, demand for the start of a new year indicates that air cargo’s slow road to recovery continues. Global volumes in January 2021 were -4.5 percent compared to the same month a year ago, similar to December, and maintained month-on-month improvements following the -13 percent gap in year-on-year chargeable weight data reported by CLIVE Data Services in November.
Available global air cargo capacity in the four weeks to 31 January was -18 percent compared to 2020.
Niall van de Wouw, managing director of CLIVE Data Services, said flights in January were ‘very full for the time of year’, which might be related to consumers spending more on (high value) products than services such as travel and leisure at the start of the year.
“January’s load factors might be considered odd compared to previous years, but they are also not surprising when you look at the current dynamics in the industry. One airline recently mentioned to me that they had ‘November volumes in January’ – but it’s not free money. The market is very demanding and constantly changing, also because of the regulatory COVID landscape. Airlines are having to ‘fly by sight’ as you simply cannot know what is around the next corner. When we read that some carriers are telling customers they cannot guarantee their capacity commitments in January and February, this tells you how full flights are. On a lane level, for example, westbound and eastbound load factors across the Atlantic were higher in January than they were in November and December at 88 percent and 76 percent respectively. Capacity is tight and we sense no underlying currents which will swiftly change this.”
Airfreight rates showed a corresponding peak in the last week of the month after a sizeable fall at the start of January, said TAC Index. It highlights:
• HKG-EUR airfreight rates dropped by -14 percent from Jan 4-18 before picking up by 12 percent to the month end (Feb 1)
• HKG-DFW declined -21 percent from Jan 4-18 but rose again by 17 percent by the end of the month
• PVG-NOA (North America) dropped from Jan 4-18 by -29 percent but by Feb 1 had recovered again by 19 percent
Robert Frei, business development director at TAC Index, commented, “The current market emphasises the difference in monthly and weekly indices. On some sectors ex Hong Kong and China, if we looked only at the monthly change in airfreight rates, we would see a near -25 percent drop in January over December. If we were not aware of the strong increase in the last week of January, we could possibly assume that, despite the upcoming Chinese New Year, there is a continuing negative trend, but market consensus has it that rate negotiations between shippers, forwarders and carriers are much more short term again (weekly or even per shipment) and, as a result, the number of spot rates has increased drastically compared to previous years. In our numbers we see big spreads.”
The latest TAC Index data shows all rates into North America increased in the last week of January. The only exception was ex-LHR, which suffered a -7 percent fall. On all other lanes, airfreight rates in the last week recorded increases from +3 percent on HKG-NOA and +9 percent from FRA-NOA to +20 percent on the PVG-NOA lane, back to the same level last seen in September 2020.
Post Brexit airfreight rates also showed the high demand for capacity to the UK, says TAC Index, based on its look into rates from Asia to Europe compared to Asia to London. In the last week of January, this showed:
• HKG-LHR: +28 percent and equal to May 2020 levels
• HKG-EUR: +6 percent
• PVG-LHR: +19 percent, matching October 2020 levels
• PVG-EUR: +7 percent


