Page 23 - ITLN January - February 2024 Issue for the Website
P. 23

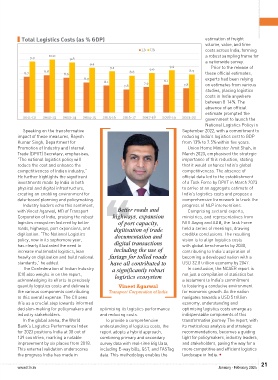
Figure 2: Components of Logistics Costs (as % to GDP)
                       10.03
                                9.81
              9.89
                                         9.41
                                                                              9.22
                                                                     9.01
                                                                                       8.90
                     8.85
            8.72
                              8.65
                                       8.30
                                                                           8.12
                                                                  7.95
                                                                                     7.85
               3.52
                                  3.46
                                           3.31
                      2.35
             2.34
                               2.30
                                                                      3.26
                                         2.20
                                                                             2.24
                                                                    2.20
                                                                                      2.19
                     1.331.33
                              1.291.29
            1.351.35
                                       1.291.29
                                                1.241.24
                                                                            1.21 1.21
                                                                  1.15 1.15
                                                                                     1.14 1.14
                                                         1.351.35
                     0.540.54
                              0.500.50
            0.540.54
                                       0.470.47
                                                                  0.270.27
                                                                           0.300.30
                                                0.470.47
                                                                                    0.360.36
                                                         0.260.26
                                  3.62
                      3.63
                               3.62
               3.58
             3.58
                                                                             3.56
                                           3.47
                                         3.47
                                                                    3.51
                                                                      3.51
                                                                                      3.51
                     0.870.87
                              0.820.82
            0.770.77
                                                0.670.67
                                                                  0.670.67
                                       0.730.73
                                                                           0.670.67
                                                         0.630.63
                                                                                    0.570.57
                     LB UB
                                                                                     LB UB
                              LB UB
                                                          LB UB
                                                                            LB UB
                                                                   LB UB
            LB UB
                                                LB UB
                                       LB UB
                              2013-14
                     2012-13
                                       2014-15
                                                                                   2021-22
            2011-12
                                                2015-16
                                                                  2017-18
                                                                            2018-19
                                                         2016-17
                                                 Water Transport
              Railway Transport 3.53  3.63  Land transport  Air transport  8.05 2.14  3.42  9.13 3.22  3.42  7.76 2.06  3.32  8.80 3.10  3.32  Supporting transport services 3.33  3.56  Other cost 3.25  3.51

        Note: Years 2019-20 and 2020-21, being abnormal years, have been excluded from the study.
       Sources: NCAER computations based on Supply and Use Tables, various years; 2023 National Accounts Statistics.

                        Figure 3: Total Logistics Costs (as % GDP)
          Total Logistics Costs (as % GDP)                                             estimation of freight
                                                                                       volume, value, and time
                                                            LB  UB                     costs across India, forming
                      10.0                                                             a robust sampling frame for
              9.9             9.8
                                       9.4                                             a nationwide survey.
                                               9.1              9.0     9.2              Prior to the release of
           8.7     8.8      8.6                        8.8                      8.9    these official estimates,
                                    8.3                                                experts had been relying
                                             8.1             7.9      8.1
                                                     7.8                      7.8      on estimates from various
                                                                                       studies, placing logistics
                                                                                       costs in India anywhere
                                                                                       between 8-14%. The
                                                                                       absence of an official
                                                                                       estimate prompted the
           2011-12  2012-13  2013-14  2014-15  2015-16  2016-17  2017-18  2018-19  2021-22    government to launch the
                                                                                       National Logistics Policy in
       LB = lower bound, UB = upper bound.
           Speaking on the transformative
       Note: Years 2019-20 and 2020-21, being abnormal years, have been excluded from the study.   September 2022, with a commitment to
        impact of these measures, Rajesh
                                                                             reducing India's logistics cost to GDP
       Sources: NCAER computations based on Supply and Use Tables, various years; 2023 National Accounts Statistics.
        Kumar Singh, Department for                                          from 13% to 7.5% within five years.
        Promotion of Industry and Internal  shown in Figure 3, suggests that logistics costs for
       The interim assessment, as                                               Union Home Minister Amit Shah, in
       India fall in the range of 7.8%–8.9% of GDP for 2021-22, using the LB and UB
        Trade (DPIIT) Secretary, emphasises,
                                                                             March 2023, emphasised the strategic
       shares of other components.                                           importance of this reduction, stating
        "The national logistics policy will  While this interim assessment provides the logistics cost
       covering all the production sectors, modes of transport, and geographies of the country but it
                                                                             that it would enhance India's global
        reduce the cost and enhance the
        competitiveness of Indian industry."
                                                                             competitiveness. The absence of
       cannot present the costs separately for these parameters, which is an essential requirement to
        He further highlights the significant
                                                                             official data led to the establishment
       track the logistics cost for a vast country like India. Hence, going forward, a comprehensive
        investments made by India in both
       study with a primary survey, is required.                             of a Task Force by DPIIT in March 2023
        physical and digital infrastructure,                                 to arrive at an aggregate estimate of
       Figure 3 also shows a declining trend in logistic costs as percent to GDP in 2014-15 and 2016-
                                                                             India's logistics costs and propose a
        creating an enabling environment for
       17, and the subsequent increase in 2017-18 and 2018-19. This could be due to several reasons,
                                                                             comprehensive framework to track the
        data-based planning and policymaking.
           Industry leaders echo this sentiment,
       including the following:                                              progress of NLP interventions.
        with Vineet Agarwal, MD of Transport      Better roads and              Comprising sectoral experts,
                                                                                    ϮϬ
          Corporation of India, praising the robust   highways, expansion    ministries, and representatives from
        logistics ecosystem fostered by better    of port capacity,          NITI Aayog and ADB, the Task Force
        roads, highways, port expansions, and    digitisation of trade       held a series of meetings, drawing
        digitisation. “The National Logistics    documentation and           credible conclusions. The resulting
        policy, now in its sophomore year,                                   vision is to align logistics costs
        has clearly illustrated the need to      digital transactions        with global benchmarks by 2030,
        increase multimodal logistics, lean      including the use of        contributing to India's aspiration of
        heavily on digitisation and build national   fastags for tolled roads   becoming a developed nation with a
        standards,” he added.                  have all contributed to       USD 32.8 trillion economy by 2047.
           The Confederation of Indian Industry   a significantly robust        In conclusion, the NCAER report is
        (CII) also weighs in on the report,      logistics ecosystem         not just a compilation of statistics but
        acknowledging its efforts to precisely                               a testament to India's commitment
        quantify logistics costs and delineate     Vineet Agarwal            to fostering a conducive environment
        the various components contributing    Transport Corporation of India   for economic growth. As the nation
        to this overall expense. The CII sees                                navigates towards a USD 5 trillion
        this as a crucial step towards informed                              economy, understanding and
        decision-making for policymakers and   optimising its logistics performance   optimising logistics costs emerge as
        industry stakeholders.             and reducing costs.               indispensable components of this
           In the global arena, the World    To provide a comprehensive      transformative journey. The report, with
        Bank's Logistics Performance Index   understanding of logistics costs, the   its meticulous analysis and strategic
        for 2023 positions India at 38 out of   report adopts a hybrid approach,   recommendations, becomes a guiding
        139 countries, marking a notable   combining primary and secondary   light for policymakers, industry leaders,
        improvement by six places from 2018.   survey data with real-time Big Data,   and stakeholders, paving the way for a
        This external validation underscores   including E-way bills, GST, and FASTag   more competitive and efficient logistics
        the progress India has made in     data. This methodology enables the   landscape in India. 
                                                                                                              21
        www.itln.in                                                                         January - February 2024
   18   19   20   21   22   23   24   25   26   27   28